By Sarah Hammer, Executive Director at the Wharton School and Adjunct Professor at the University of Pennsylvania Carey Law School
America stands at the precipice of a digital finance revolution—a historic opportunity to lead global innovation, but one that other nations are rapidly mobilizing to capture. Throughout my career investigating how technology can transform our financial system, I’ve gained firsthand insight into this critical juncture. As a derivatives trader, I was acutely aware of the risks embedded in our settlement infrastructure: the potential for failed trades, capital inefficiently locked for days, and the financial system exposed to unnecessary risk. Our financial markets—sophisticated in financial analysis and instruments but antiquated in settlement—operate on infrastructure that hasn’t fundamentally evolved in decades.
Blockchain presents an elegant solution—near-instant settlement finality. My 2018 paper, The Blockchain Ecosystem, provided insight for policymakers on how to incentivize a strong blockchain ecosystem with reduced vulnerabilities. By 2021, as global adoption accelerated, I reiterated my call for a clear and comprehensive regulatory framework. In 2022, I published A Comprehensive Approach to Crypto Regulation, setting forth clear principles for a digital assets regime. In November 2024, I published “Why America Needs Bold Crypto Legislation Now,” presenting a strong argument that our window for leadership was rapidly closing.
Today, the hard numbers confirm that America’s competitive edge in digital assets is eroding— precisely as predicted. While U.S. policymakers deliberate, other nations act decisively. The European Union’s comprehensive MiCA framework, Dubai’s forward-looking approach, and Singapore’s pragmatic policies are not just attracting capital—they’re reshaping the future of finance.
The evidence speaks for itself. Through empirical metrics on venture capital flows, user engagement, transaction volumes, and adoption patterns, we can now measure America’s declining position with precision. As we advance through 2025, the stakes have never been higher. Without immediate action to establish a comprehensive regulatory framework, the United States risks surrendering its financial leadership in this crucial sector.
Empirical Evidence of Declining U.S. Position
The data on venture capital flows reveal a concerning trajectory. In Q2 2023, U.S.-based digital asset enterprises secured 45% of global venture funding;¹ by the following quarter, this share had declined to 34%.² This represents a significant venture capital shift, with nearly two-thirds of digital asset investment now directed toward jurisdictions with established regulatory frameworks, including Singapore, the United Arab Emirates, and the United Kingdom.³ In the context of digital asset markets, this 11% decline signals a dramatic realignment.
Beyond venture capital migration, we are witnessing increased focus on foreign jurisdictions. As one example, Circle, the issuer of USDC, obtained an e-money license in France and became the first stablecoin issuer to achieve compliance with the European Union’s Markets in Crypto-Assets (MiCA) regulation.⁴ This strategic move reflects a broader trend, as industry leaders and founders increasingly cite a preference for foreign jurisdictions that have established regulatory environments for sustainable growth.⁵
Building on this evidence, global adoption metrics reinforce this pattern of competitive realignment. Reports from Chainalysis indicate that while the United States improved from 8th in retail digital asset adoption in 2021⁶ to 4th in both 2023⁷ and 2024,⁸ this advancement has plateaued. Meanwhile, European and Asian jurisdictions continue to gain market share, supported by comprehensive regulatory clarity that fosters both innovation and consumer protection.
Measurable Market Divergence
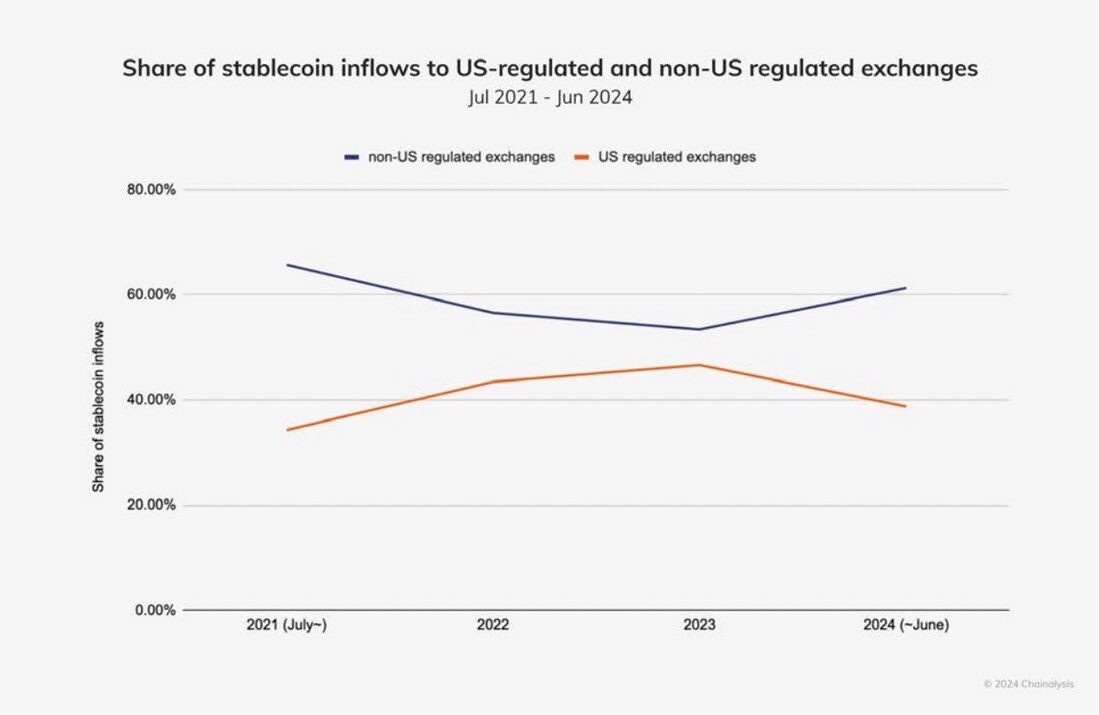
The evidence of shifting market dynamics extends beyond funding patterns and business location preferences. Despite achieving record activity levels, U.S. digital asset markets have encountered significant challenges in maintaining their competitive position over the past year. Most notably, stablecoin transactions—a critical indicator of market activity and user engagement—have demonstrably shifted away from U.S.-regulated platforms toward international alternatives. This migration coincides with regulatory uncertainty in the U.S. and increasing clarity abroad.
Visualizing this trend reveals a clear pattern of market redistribution. Through 2023, U.S.- regulated exchanges steadily increased their share of global stablecoin transaction volume. However, in 2024, this trajectory reversed as non-U.S. platforms gained predominance.⁹ Notably, this redistribution may reflect a relative rather than absolute decline in U.S. market activity, driven primarily by accelerated stablecoin adoption in emerging markets and jurisdictions offering regulatory clarity.
Source: Chainalysis

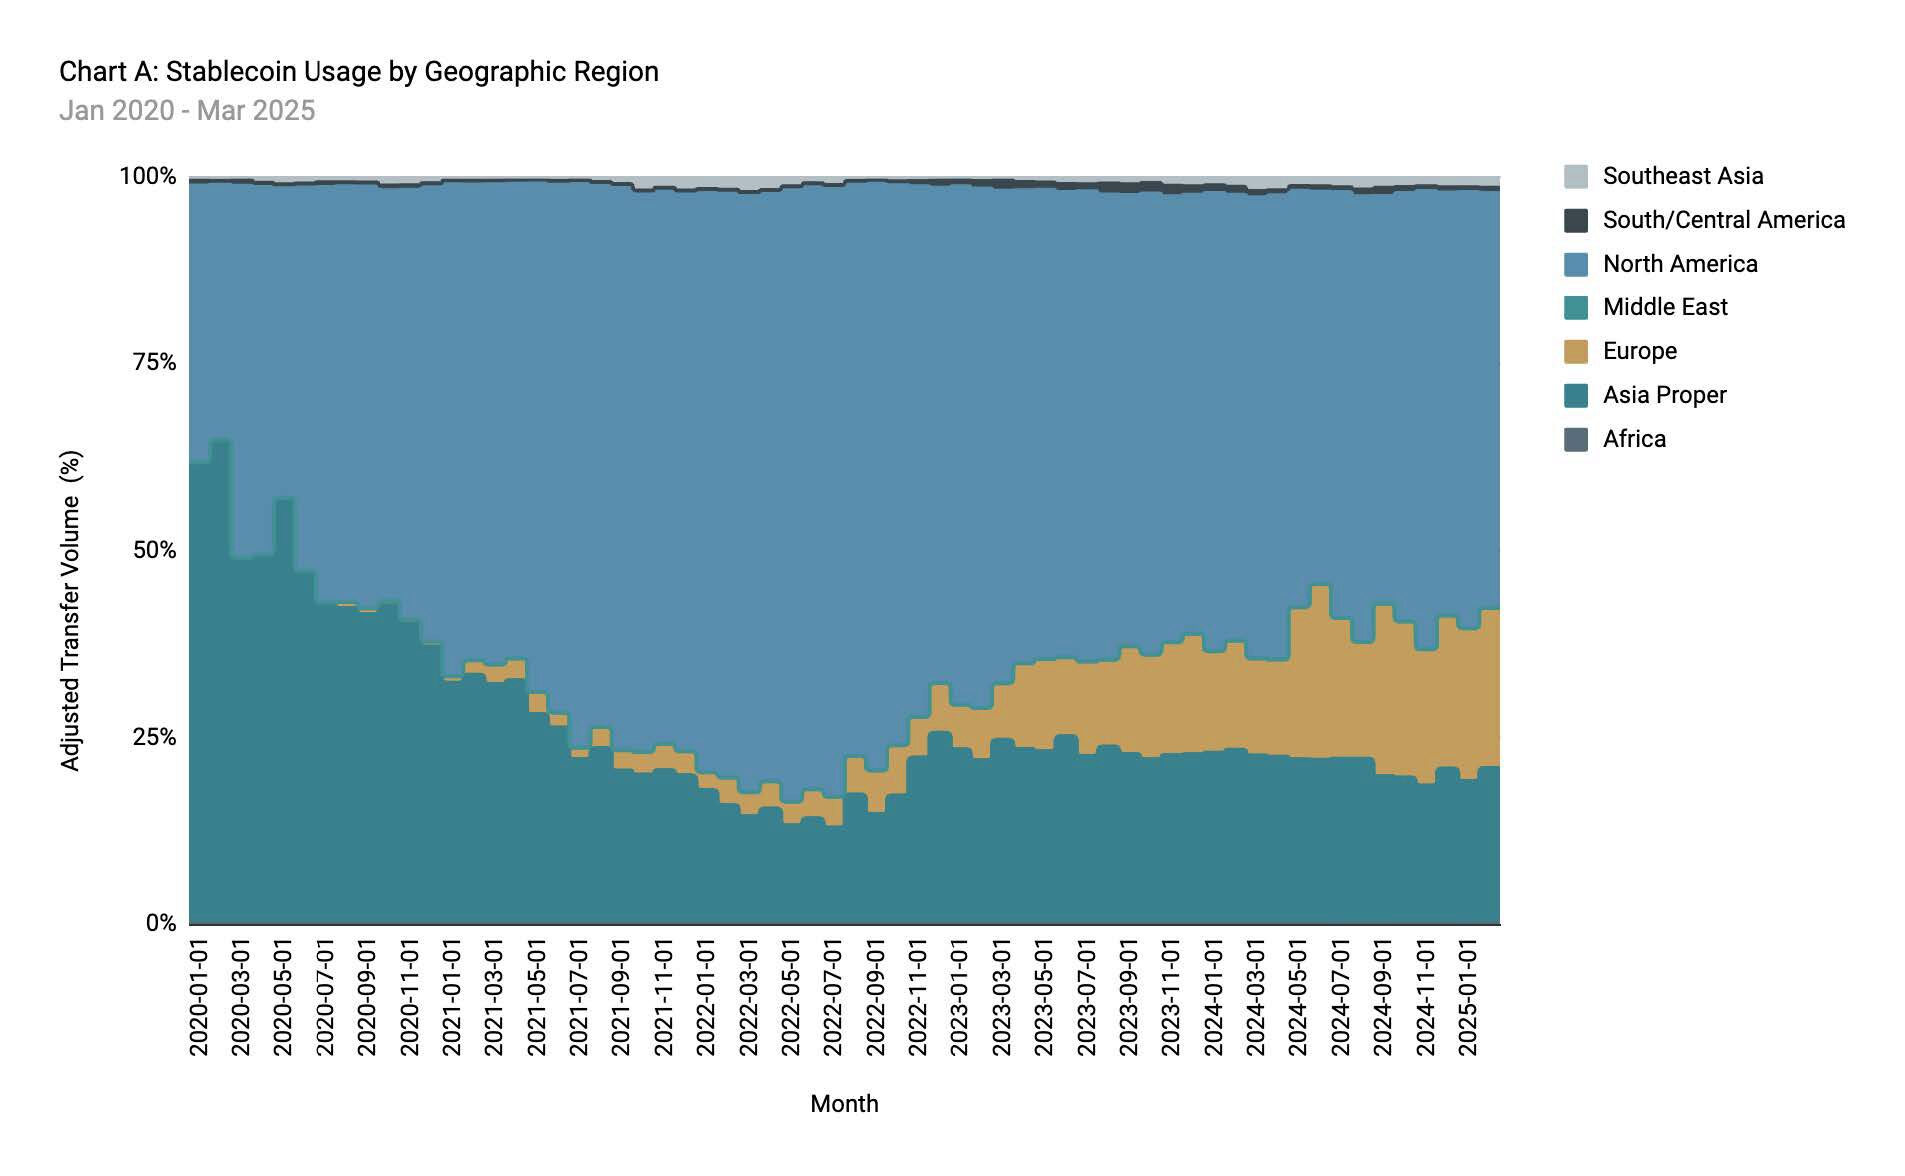
Time-series data on geographic distribution further substantiates these market shifts. In January 2020, North America accounted for 37% of global trackable stablecoin transfers while Asia represented 61% and Europe 0%. North America’s share peaked at 82% in May 2022¹⁰ with Europe at 7%. However, by December 2024, North America’s share dropped to 61% and Europe’s share rose from 0% to 21% over the same period. Notably, the EU’s adoption of MiCA in May 2023¹¹ and stablecoin regulation implementation in June 2024¹² did not hinder activity. On the contrary, European stablecoin usage accelerated, potentially indicating a positive relationship between regulatory clarity and market growth.¹³
Source: artemis.xyz

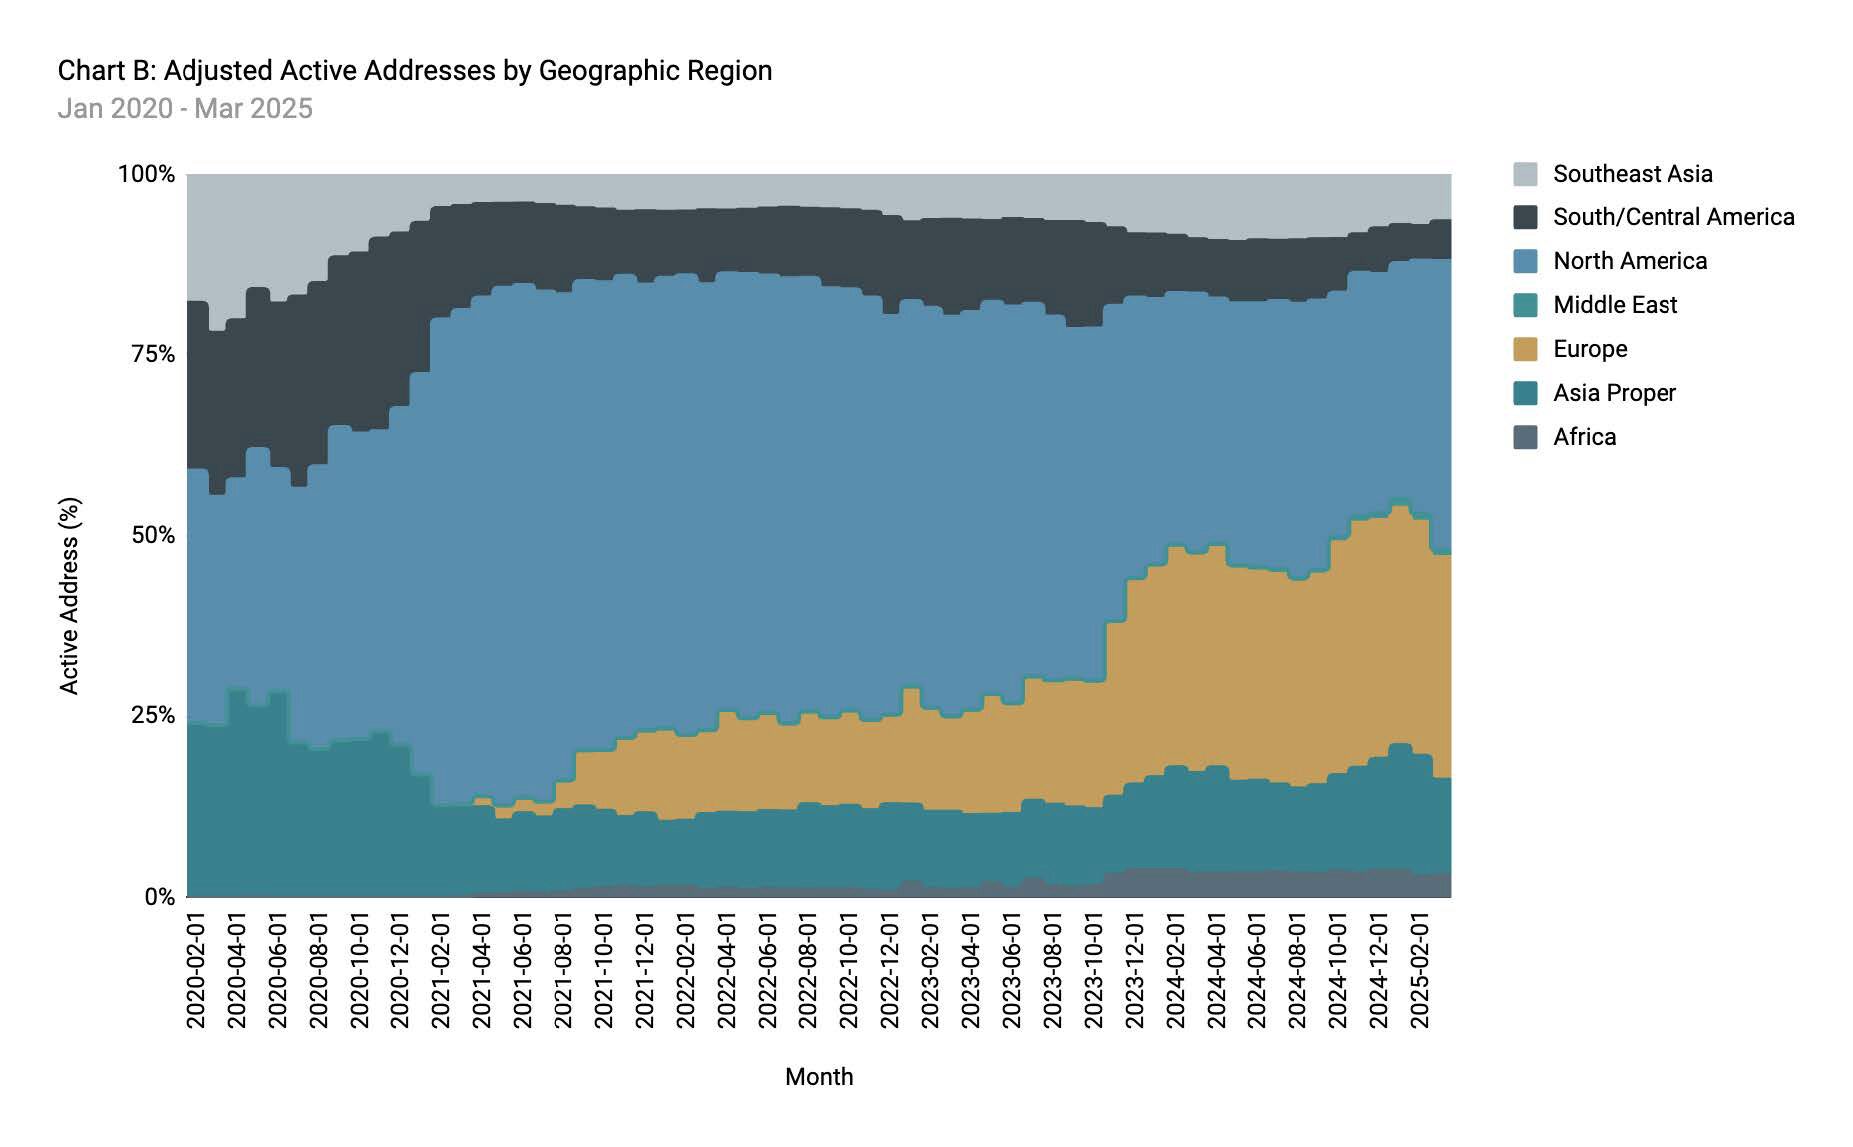
Looking beyond user numbers to other economic activity, examination of user engagement metrics as represented by active sending addresses reinforces this pattern of geographic redistribution.¹⁴ In April 2021, North America peaked at about 75%. While it dominated through Q2 of that year, its lead eroded rapidly through 2023 and 2024.¹⁵ As of early 2025, the EU clearly rivals North America, showing how legal certainty appears to have driven deeper engagement.¹⁶
Source: Artemis.xyz

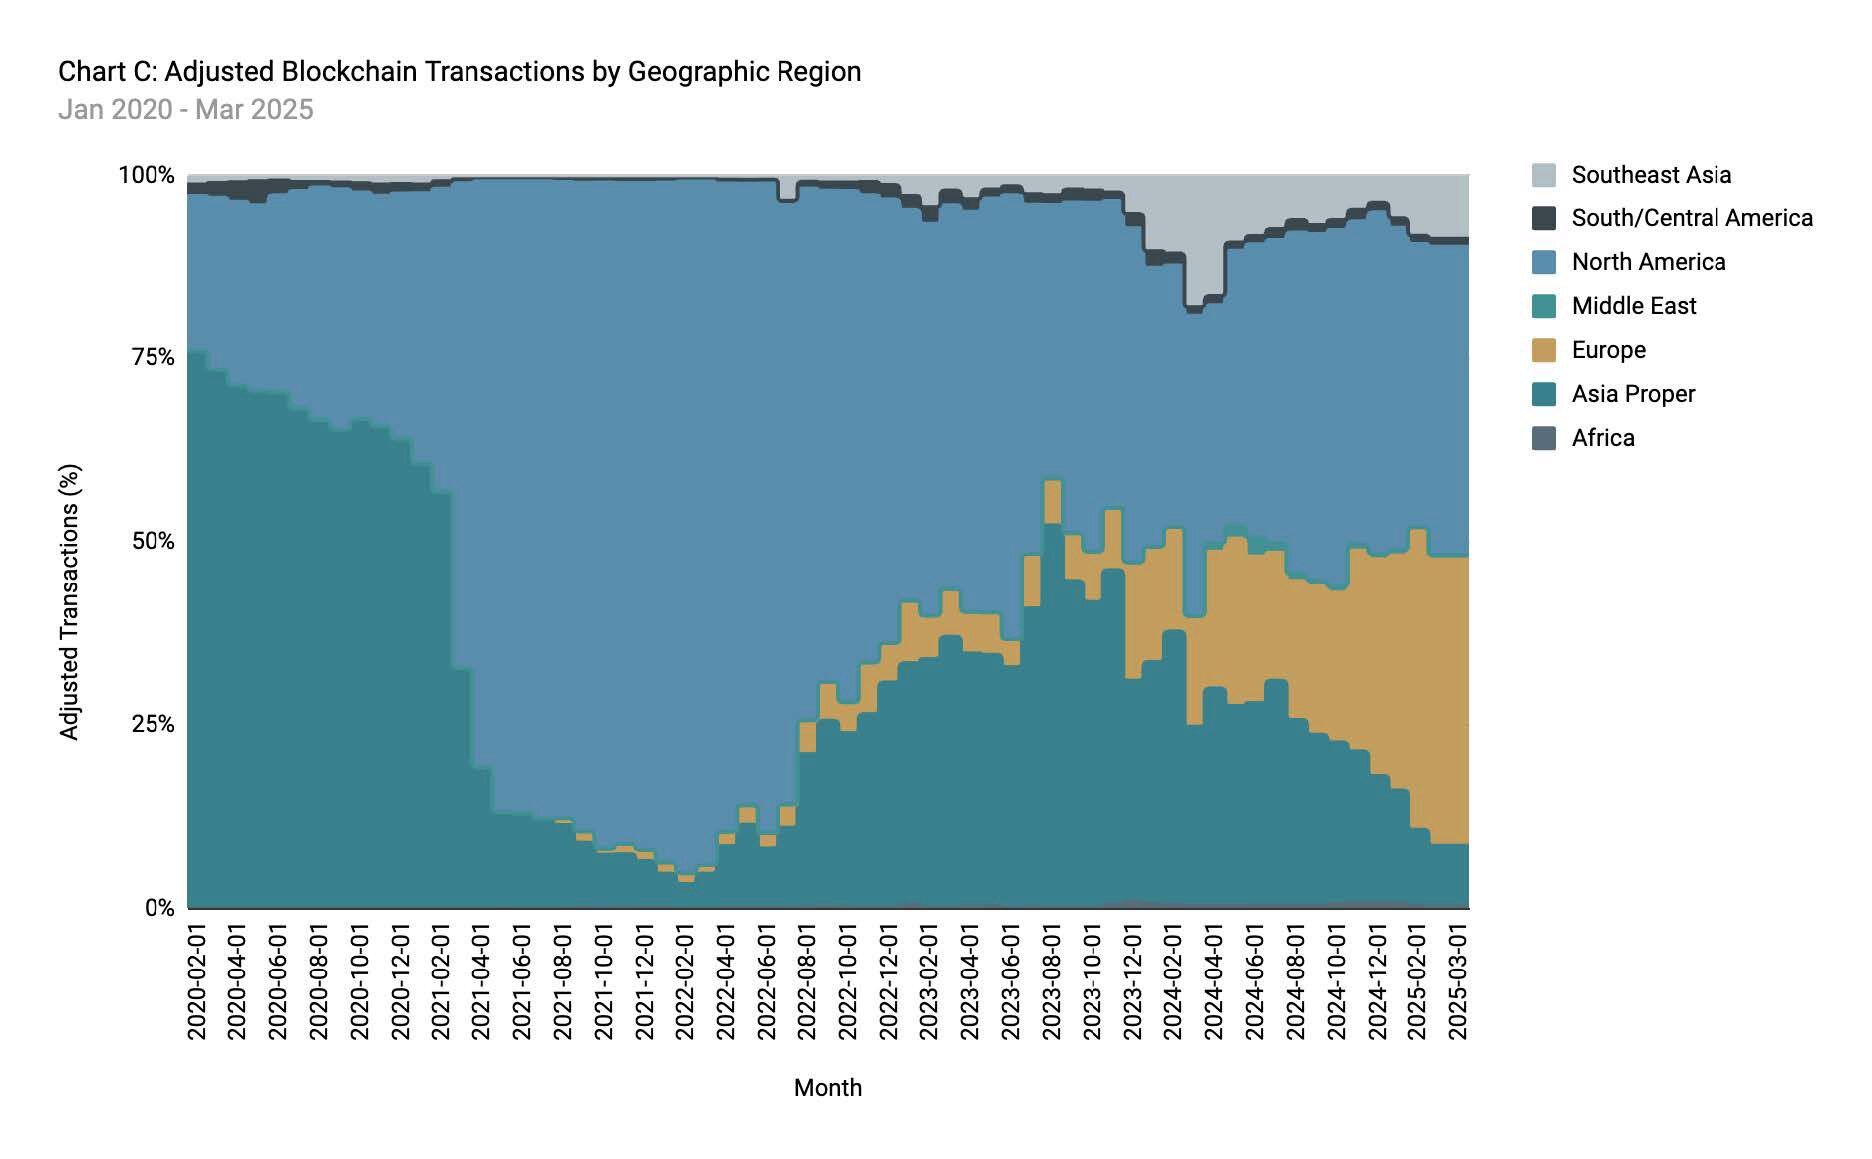
Transaction volume data provides additional confirmation of this competitive realignment.¹⁷ In Q2 and Q3 2022, North America accounted for nearly 95% of all global transactions. As of March 2025, the EU is poised to surpass it.¹⁸ Again, the MiCA framework did not suppress activity—it appears to have expanded it, reinforcing the role of regulatory clarity in sustaining market vitality.
Source: Artemis.xyz
The Policy Imperative
The data paints an unambiguous picture: America’s first-mover advantage in digital finance is rapidly eroding. This isn’t merely a theoretical concern—it’s empirically measurable through shifting venture capital flows, evolving user engagement patterns, and changing transaction volumes. The evidence reveals not just a competitive challenge but a strategic inflection point for U.S. financial leadership.
As jurisdictions like the EU, Singapore, and the UAE demonstrate, regulatory clarity doesn’t stifle innovation—it accelerates it. Their frameworks haven’t constrained growth; they’ve catalyzed it, creating fertile ground for investment and innovation while establishing crucial consumer safeguards.
The path forward demands more than incremental policy adjustments. America requires a comprehensive regulatory architecture that establishes clear jurisdictional boundaries between agencies, develops thoughtful asset classification principles, implements robust stablecoin oversight, and ensures strong and meaningful consumer protections.
The global digital asset landscape is being rewritten now—not in the distant future. Without decisive action to establish this framework, the United States risks becoming a secondary player in the very financial revolution it helped initiate. The window for securing America’s position at the vanguard of this transformation remains open, but the choice is clear: lead deliberately or follow by default.
1 Lyons, Ciaran, “US ‘dominates’ crypto startup funding in A2: Report,” Cointelegraph (16 July 2023), https://cointelegraph.com/news/us-crypto-startup-in-q2-galaxy-digital
2 Thorn, Alex and Parker, Gabe, “Crypto and Blockchain Venture Capital Q3,” Galaxy Research (13 October 2023), https://www.galaxy.com/insights/research/crypto-and-blockchain-venture-capital-q3-2023/
3 Thorn, Alex and Parker, Gabe, “Crypto and Blockchain Venture Capital Q3,” Galaxy Research (13 October 2023), https://www.galaxy.com/insights/research/crypto-and-blockchain-venture-capital-q3-2023
4 Press Release, “Circle is First Global Stablecoin Issuer to Comply with MiCA, Europe’s Landmark Crypto Law” (1 July 2024), https://www.circle.com/pressroom/circle-is-first-global-stablecoin-issuer-to-comply-with-mica-eus-landmark-crypto-law
5 Wilser, Jeff, “US Crypto Firms Eye Overseas Move Amid Regulatory Uncertainty” (27 March 2023; updated 30 March 2023), https://www.coindesk.com/consensus-magazine/2023/03/27/crypto-leaving-us
6 Chainalysis, The 2021 Geography of Cryptocurrency Report, Analysis of Geographic Trends in Cryptocurrency Adoption and Usage (October 2021), https://go.chainalysis.com/rs/503-FAP-074/images/Geography-of-Cryptocurrency-2021.pdf
7 Chainalysis, The 2023 Geography of Cryptocurrency Report, Everything You Need to Know About Crypto Adoption Around the Globe (October 2023), https://www.chainalysis.com/wp-content/uploads/2024/06/the-2023-geography-of-cryptocurrency-report-release.pdf
8 Chainalysis, The 2024 Geography of Cryptocurrency Report, Everything You Need to Know About Crypto Adoption Around the Globe (October 2024), https://www.chainalysis.com/wp-content/uploads/2024/10/the-2024-geography-of-crypto-report-release.pdf
9 Chainalysis, The 2024 Geography of Cryptocurrency Report, Everything You Need to Know About Crypto Adoption Around the Globe (October 2024), https://www.chainalysis.com/wp-content/uploads/2024/10/the-2024-geography-of-crypto-report-release.pdf
10 Peak percentage may have been due to the role of FTX.
11 MiCA Papers, “Implementation Timeline,” https://micapapers.com/guide/timeline/
12 MiCA Papers, “Implementation Timeline,” https://micapapers.com/guide/timeline/
13 MiCA Papers, “Implementation Timeline,” https://micapapers.com/guide/timeline/
14 Source: Artemis.xyz. Note: The dataset represents unique sending addresses of stablecoins on Ethereum and Solana, with approximately 20% of the data being identifiable. Filtering criteria include: (1) selecting the largest transfer amount when a single transaction contains multiple stablecoin transfers, (2) excluding MEV and bot activity, and (3) removing intra-exchange transfers. This dataset captures approximately 5% of total adjusted active addresses.
15 The data set tags approximately 15-37% of global usage.
16 Data set consists of Ethereum and Solana. About 5% of the data is taggable.
17 Source: Artemis.xyz. Note: The dataset reflects active stablecoin addresses on Ethereum and Solana, with roughly 20% of the data being identifiable. The data is filtered as follows: (1) for transactions with multiple stablecoin transfers, only the largest transfer amount is considered, (2) MEV and bot activity are excluded, and (3) intraexchange transfers are removed.
18 Source: Artemis.xyz. Note: The dataset represents stablecoin transaction volume, with approximately 15% of the volume being identifiable. Filtering criteria include: (1) selecting the largest transfer amount when a single transaction includes multiple stablecoin transfers, (2) removing MEV and bot activity, and (3) excluding intraexchange transfers.


